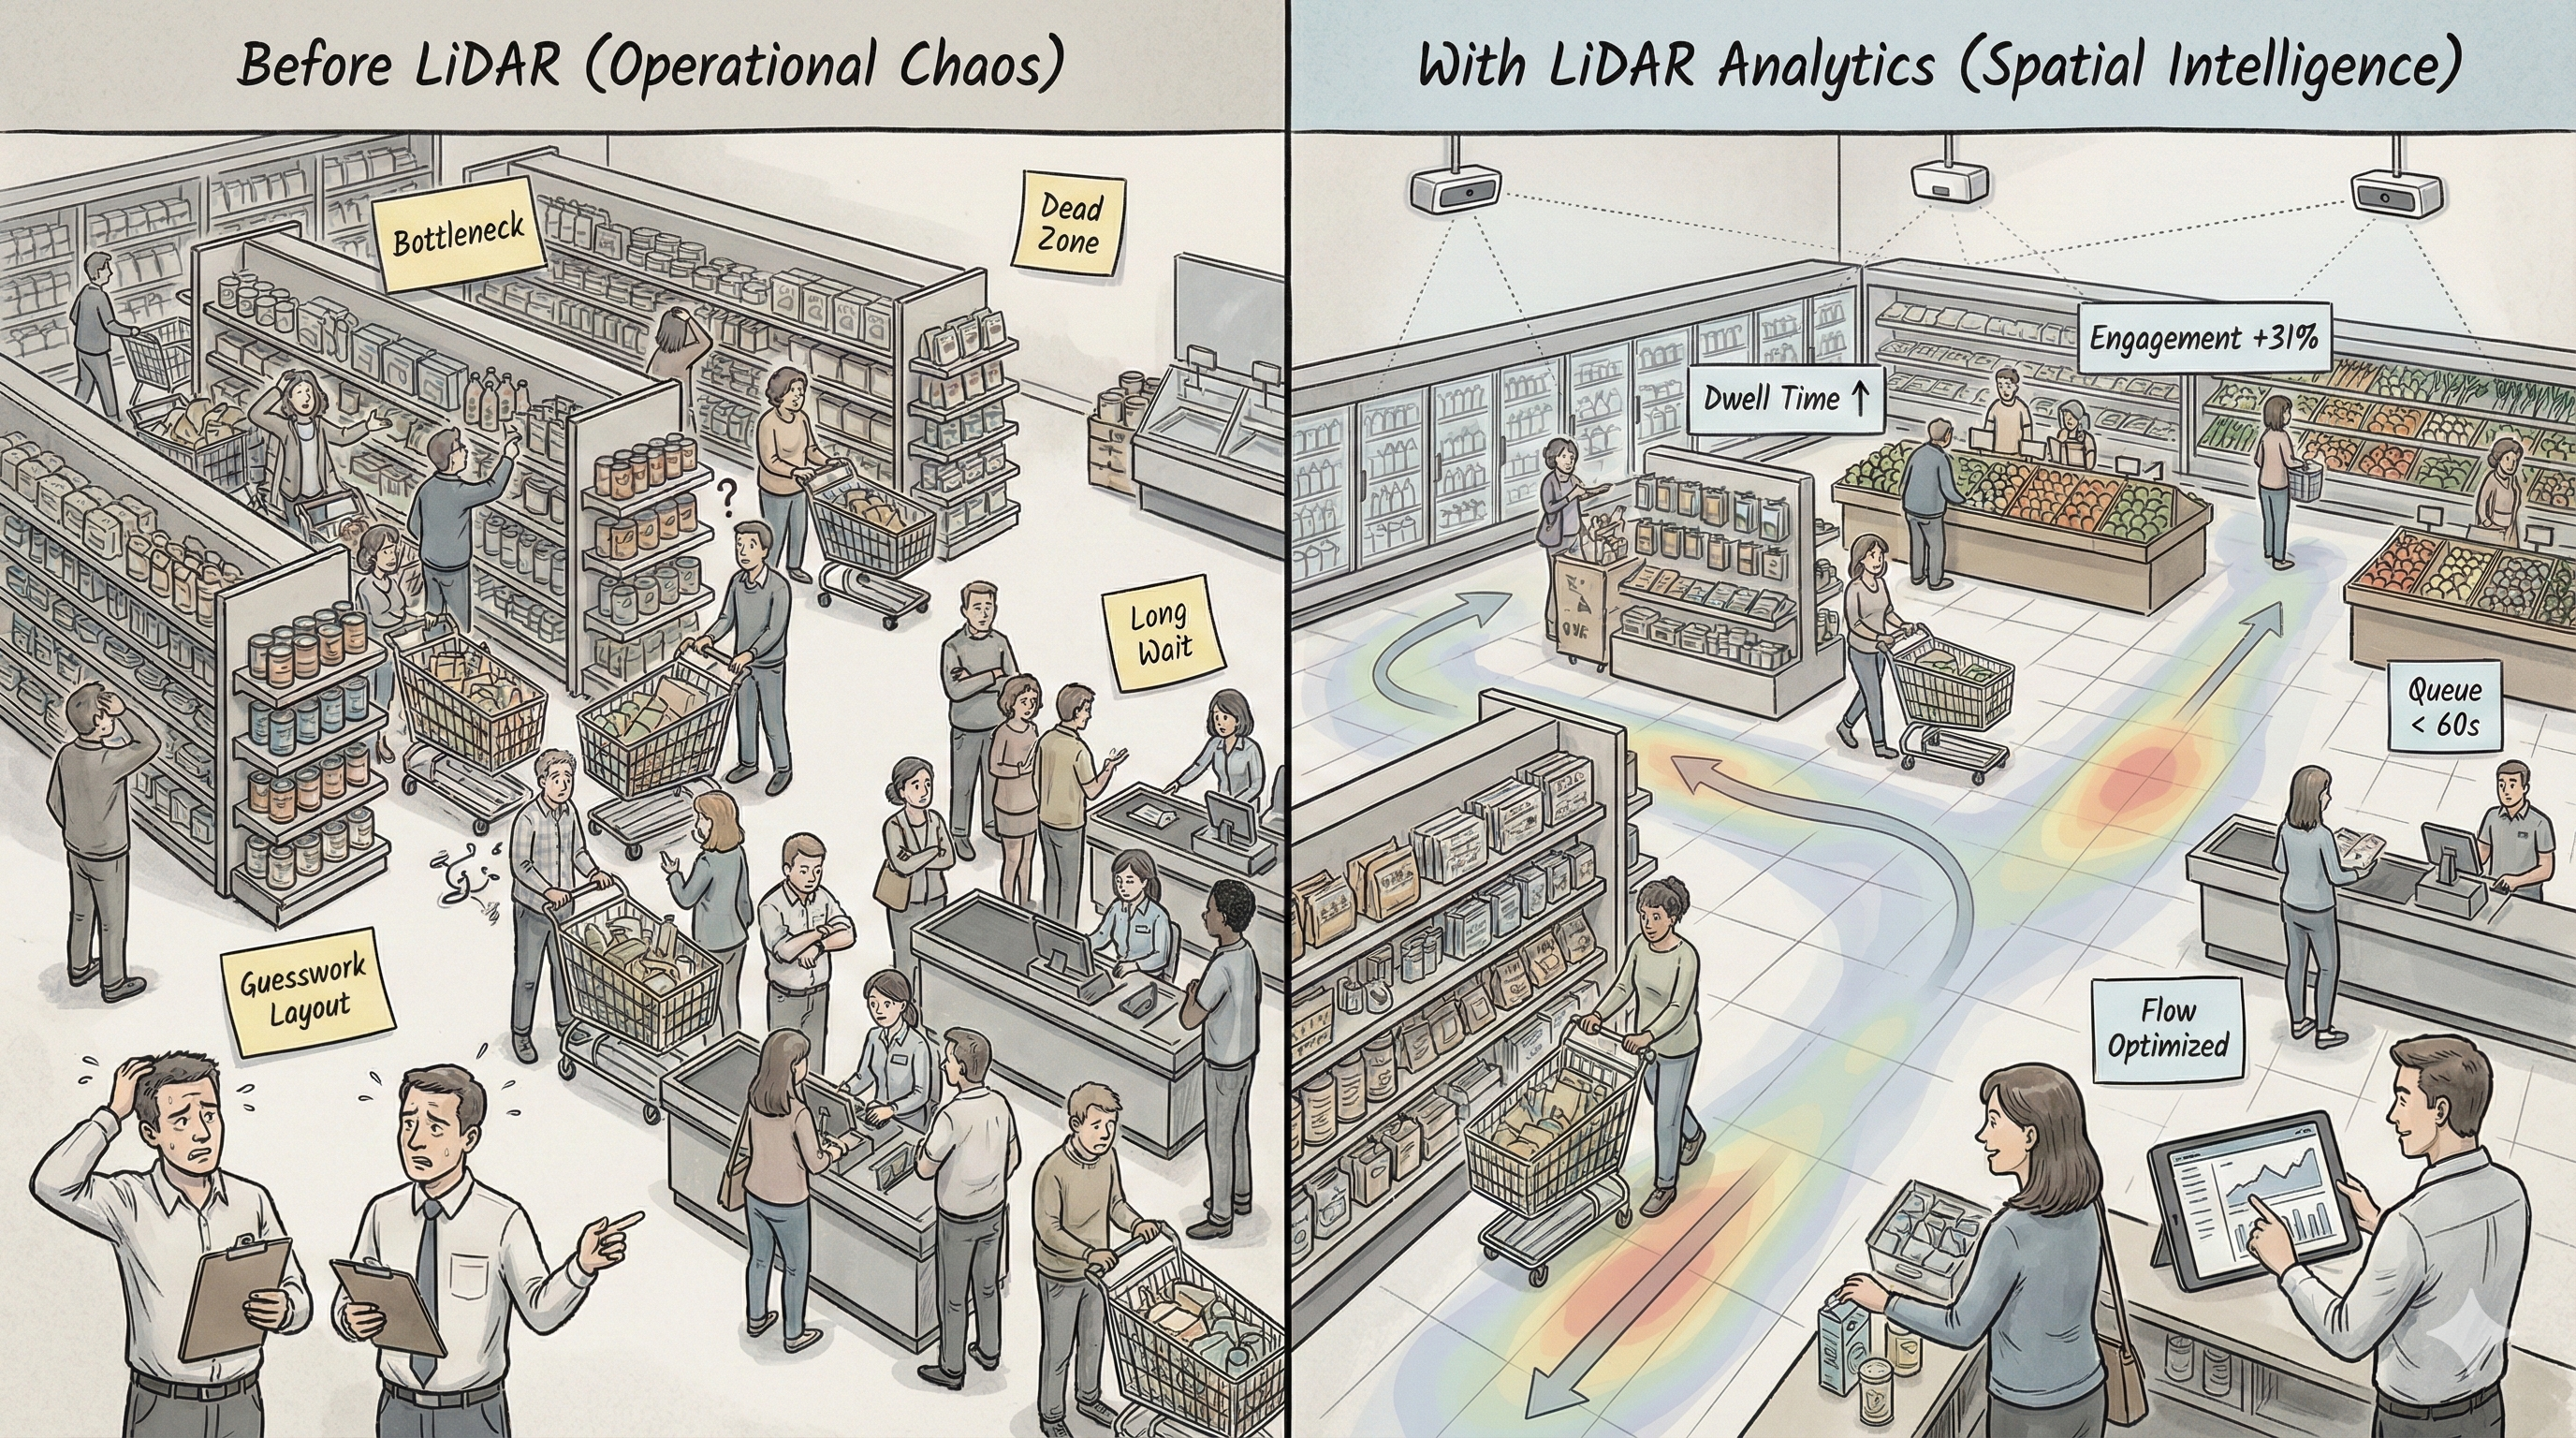
For decades, grocery retailers have relied on a mix of sales data, anecdotal evidence, and sheer intuition to design their store layouts. While online retailers can track every click and scroll, their brick-and-mortar counterparts have been flying blind, unable to truly understand how shoppers navigate their stores. This measurement gap leads to congested aisles, underperforming promotions, and millions in lost revenue.
Traditional methods like cameras and Wi-Fi tracking have proven inadequate. Cameras raise significant privacy concerns and are unreliable in varied lighting, while Wi-Fi tracking only captures a small, statistically insignificant sample of shoppers.
Enter LiDAR (Light Detection and Ranging). By using lasers to create a real-time 3D map of a space, LiDAR provides hyper-accurate, anonymous tracking of every person and object. It's the same technology used in self-driving cars, now repurposed to bring unprecedented spatial intelligence to the grocery aisle.
Here are five ways LiDAR-powered platforms like Hyperspace are revolutionizing grocery store layouts.
1. Optimizing Aisle Flow & Eliminating Bottlenecks
The Problem: Every store has them — aisles where carts clash, shoppers get stuck, and frustration builds. These bottlenecks not only create a poor customer experience but also lead to abandoned shopping trips and lost sales.
The LiDAR Solution: Hyperspace generates precise heatmap visualizations that show the entire store's traffic patterns over time. Using data from ceiling-mounted LiDAR sensors, the platform tracks every shopper's path with millimeter-level accuracy, creating a complete picture of movement — not just a sample.
With this data, managers can identify exactly where congestion occurs, at what times of day, and for how long. The AI Narrator feature even proactively alerts you when occupancy exceeds normal thresholds, suggesting immediate actions like opening additional checkout lanes or repositioning displays.
With this data, managers can A/B test layout adjustments with confidence. Should we widen the main aisle by six inches? Should we move the popular pasta sauce to a less-trafficked area? LiDAR provides the empirical data to answer these questions, turning layout design from a guessing game into a science.
2. Perfecting Endcap & Promotional Display Placement
The Problem: CPG brands pay a premium for endcap and promotional placements, but retailers have little data to prove their effectiveness beyond final sales numbers. Was it the product, the price, or the placement that drove sales?
The LiDAR Solution: Hyperspace's Zone Analytics measure engagement at the display level with unprecedented precision:
This creates a data-driven marketplace for in-store real estate. Instead of charging flat fees for endcaps, retailers can price based on actual traffic and engagement metrics.
The Planogram Connection: Hyperspace's Planogram Builder goes even further, mapping specific SKUs to shelf positions. The Shelf Analytics feature calculates engagement metrics per product, showing which items attract attention and which are being ignored.
3. Enhancing the Fresh & Prepared Foods Experience
The Problem: The perimeter — fresh produce, bakery, deli, and prepared foods — is a key profit center for grocers. But these areas are often chaotic, with complex traffic patterns and unpredictable demand.
The LiDAR Solution: Hyperspace's Queue Management system tracks:
The system can be configured with alert thresholds — send a notification when wait time exceeds 3 minutes or queue length hits 5 people, enabling dynamic staffing.
4. Reimagining the Checkout Area
The Problem: Long checkout lines are a primary driver of customer dissatisfaction. Self-checkout has helped but introduced new challenges: congestion, user confusion, and the need for staff assistance.
The LiDAR Solution: Hyperspace's Checkout Manager provides a real-time dashboard with color-coded alerts:
Wait < 60 seconds
Wait 60–120 seconds
Wait > 120 seconds
When a queue hits the warning threshold, the system sends an instant alert to managers, prompting them to open a new lane. Historical data also allows A/B testing different checkout configurations — optimal ratios of self-checkout to traditional lanes, and best staff positioning.
5. Validating Planogram & Category Changes
The Problem: Category managers invest heavily in planograms but have no way to measure their true impact on shopper behavior after implementation.
The LiDAR Solution: By comparing behavior before and after a planogram reset, Hyperspace measures:
- Dwell Time Change — Did shoppers spend more or less time?
- Engagement Rate Change — Did more shoppers stop to browse?
- Browsing Patterns — Which shelf sections attracted attention?
- Flow Efficiency — Did the layout improve movement?
- Conversion Impact — Did it drive more purchases? (with POS data)
The Planogram Builder creates a digital twin of your shelf layout, and Shelf Analytics calculates engagement for each product and section — hot zones vs. dead zones, browsing rate, average browse time.
The Future is Data-Driven
The era of designing stores based on gut feeling is over. LiDAR-powered spatial intelligence gives grocery retailers the same level of granular, actionable insight that e-commerce giants have enjoyed for years.
About Hyperspace: Hyperspace is the leading Physical AI platform for retail, using LiDAR sensors to provide privacy-first spatial analytics. Our mission is to help retailers understand and optimize their physical spaces without compromising customer privacy.